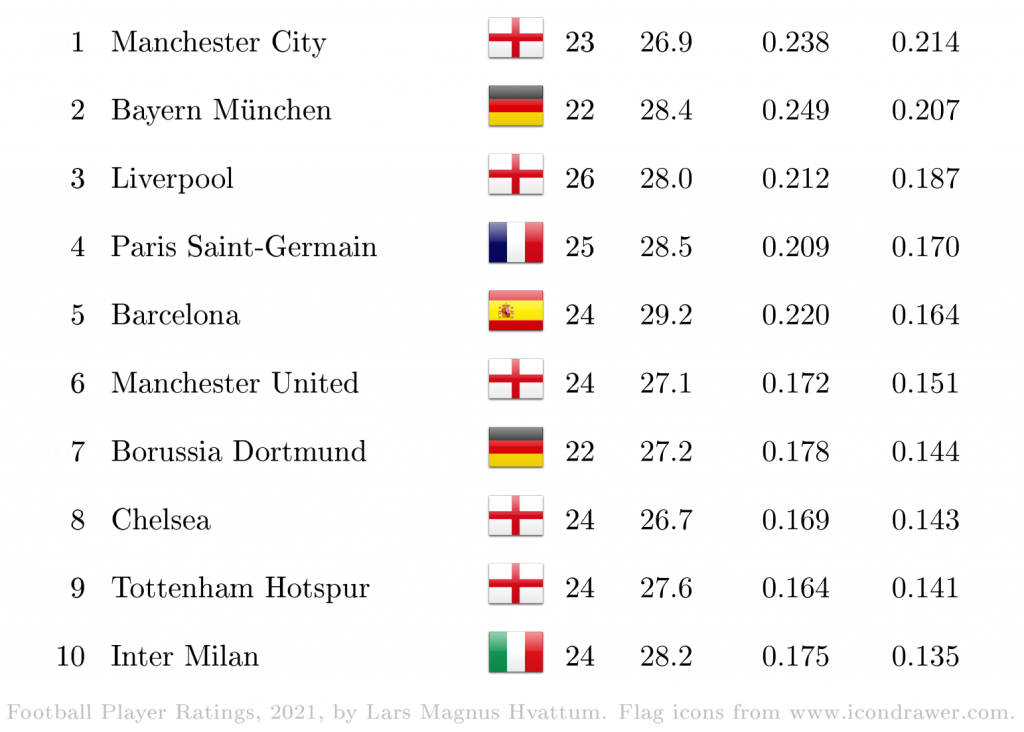
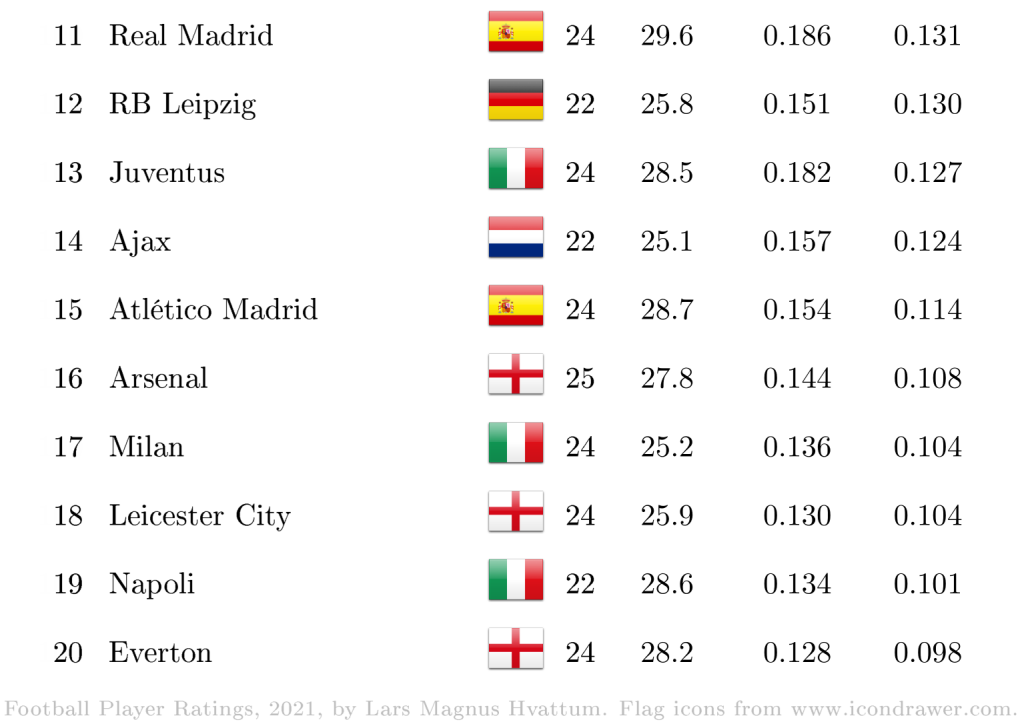
Based on popular demand, a list of the top 20 domestic teams have been created as of July 2021. The teams are rated based on the average plus-minus rating of their 15 highest-rated players. Similar lists have been published before in the form of YouTube-videos. In the top 10, there is one team in particular that is noticeably missing!
Hi Lars,
Would it be possible to look at the starting XI for every weekly match in the domestic league and Champions/Europa League for each team instead of the top 15 players? That way you base the data on actual team selections rather than a hypothetical top 15.
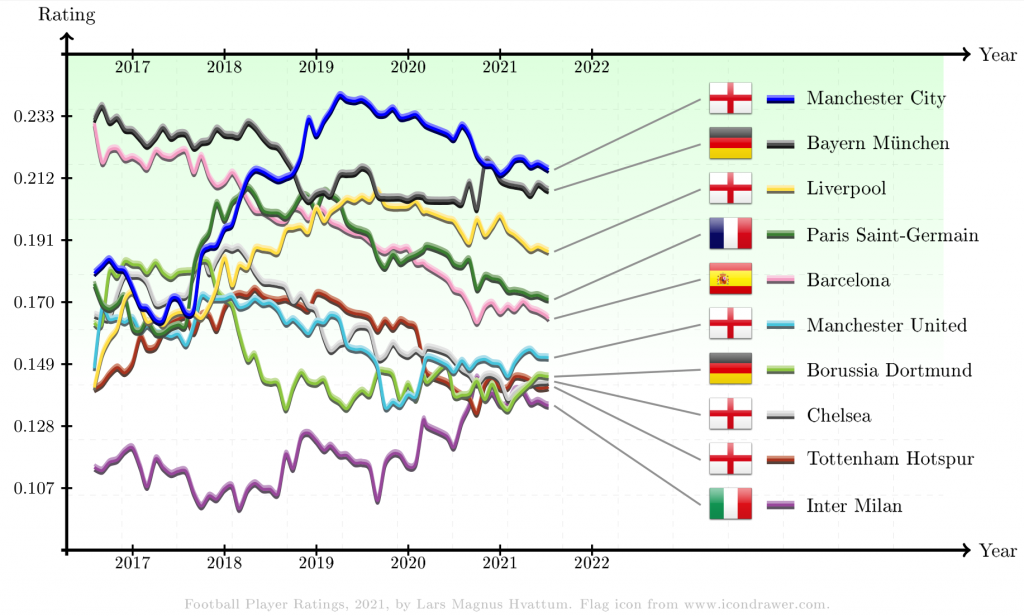
Also does your model include manager effects? Based on my understanding of your model if a manager has been at a club long enough then the average score of the players will go up, so managers are indirectly factored in though the model will be blind to this? It would be better to separate out managers as the 12th player in the model. I wrongly assumed that Man City’s significant rise since late 2017 was all due to Pep, but he joined a season earlier and looking back they spent about £200mil net that summer on players such as Laporte, Walker, Silva, Ederson and Mendy. Would be excited to see a top 100 managers list.
I assume your model treats home field advantage the same for all teams? Would it be possible to add stadiums as the 13th player in the model? That way you can see the effect of home field advantage change over time with the absence of fans due to COVID, or when a team changes over to a new stadium. Again a list of the top 100 stadiums would be interesting to observe.
As for the missing team in the top 10, I’m going to guess Real Madrid are missing?
Thanks for the very interesting feedback!
1) It would be possible indeed. My suspicion is that it would not change much (for good teams, it seems that most of the time the highest-rated players are selected). Nevertheless, it could be nice to check if there are some teams that deviate.
2) No manager effects included, except indirectly. This has come up on occasion, and it has been a long while since I tested including managers (including them back then did not change the ratings of the players much, I seem to recall). However, for a complete evaluation of managers, additional factors must also be included (that cannot be captured by plus-minus). It is on the to-do list, for sure.
3) The home field advantage is modelled per league system (so, different in say Spain and France). For sure, COVID makes it tricky, since factors such as attendance are not taken into account. From past calculations I suspect that it is really difficult to estimate a team-specific home field advantage (there is simply not enough data points to do this reliably).
4) Yes, Real Madrid has been top 3 as long as I have been calculating this, so it was a big change to see them suddenly out of the top 10.
Hi Lars,
Thanks for responding. Just some follow up questions:
What additional factors would you need to consider when assessing managers which cannot be captured by plus-minus?
As for team specific home field advantage, this would be incorporated as the 13th player in the model (manager would be 12th). Am I missing something? As teams play both home and away plus-minus should have enough contrasting data to differentiate the relative advantage conferred by playing at home. If the teams played all their matches at home then plus-minus would probably not work as well, but the teams play half the domestic league games at home and the other half away so this should theoretically work.
Do you include in match fatigue? If a sub comes on late in the game then he is fresher relative to other players who started the match. Fatigue due to fixture pile up also seems to be a phenomenon with the big teams playing 50+ games and some players suffer due to being over exerted. Is this something your model takes into account?
As I understand it your model reflects an average age curve of all players in the database which is then applied to each player. Do you know if elite players for example the top 50 also follow the average age curve. From my observation of other plus-minus systems an average age curve does not fit well with elite players. Average curves tend to underestimate elite youth talents (18-23 yo) and reduces the ratings of much older elite players (30+ yo).
Good follow-ups! I do have some thoughts (not necessarily entirely correct):
2) A few aspects of managers that plus-minus can be used to assess, although not directly: Ability to recruit suitable players; ability to select the correct starting line-up; ability to educate the players to become better (meaning that the plus-minus ratings of the players should improve); and tactical ability – directly influencing the outcome of a match from the side-line (this is what a manager-factor in the plus-minus model could detect).
3) I just do not believe that a team-specific home field advantage exists. Sure, it depends on travel distance, crowd size, playing surface, and a few other factors that differ between teams. However, I would model these factors directly rather than trying to derive a team-specific advantage.
5) Match fatigue: was tested in an early model, and is on the list of things to test again in the future. Fatigue due to fixture pile up is in the same list.
6) Age curves: yes, only the average is reflected now, and some players outperform this, while others perform worse than the curve suggests. I would think that the tendency to underestimate elite youth talents is a human bias (one usually focuses on the Hålands and not the Adus). We have some work planned that may end up improving this aspect of the model, though.